AutoVA - Automated VCMA & AHE Measurement System
AutoVA - Automated VCMA/(magnetoelectric coupling) - Anomalous Hall effect Measurement System.
The software is used to control :
- The E-field applied for the VCMA/Magnetoelectric coupling. (with the ramping function).
- The E-fields can have multi-variants - (dwelling, pulser).
- The electromagnetic filed.
- The Soure Measure Unit (SMU) to apply one bias-current, and meanwhile measuring the Hall Voltage. Hysteresis loops can be obtained by looping the electromagnetic field.
The software has following features:
AutoVA_1.0.0
- Compatible with a large amount of SMUs, and instruments
- Experiments procudures visualised
- GUI for graphing live data
- managing queues of experiments.
- Data auto-generation
AutoVA_1.0.1
The automated experiment time can be estimated and updated in real time.
AutoVA_1.0.2
The progressbar for single meaurement will be shown
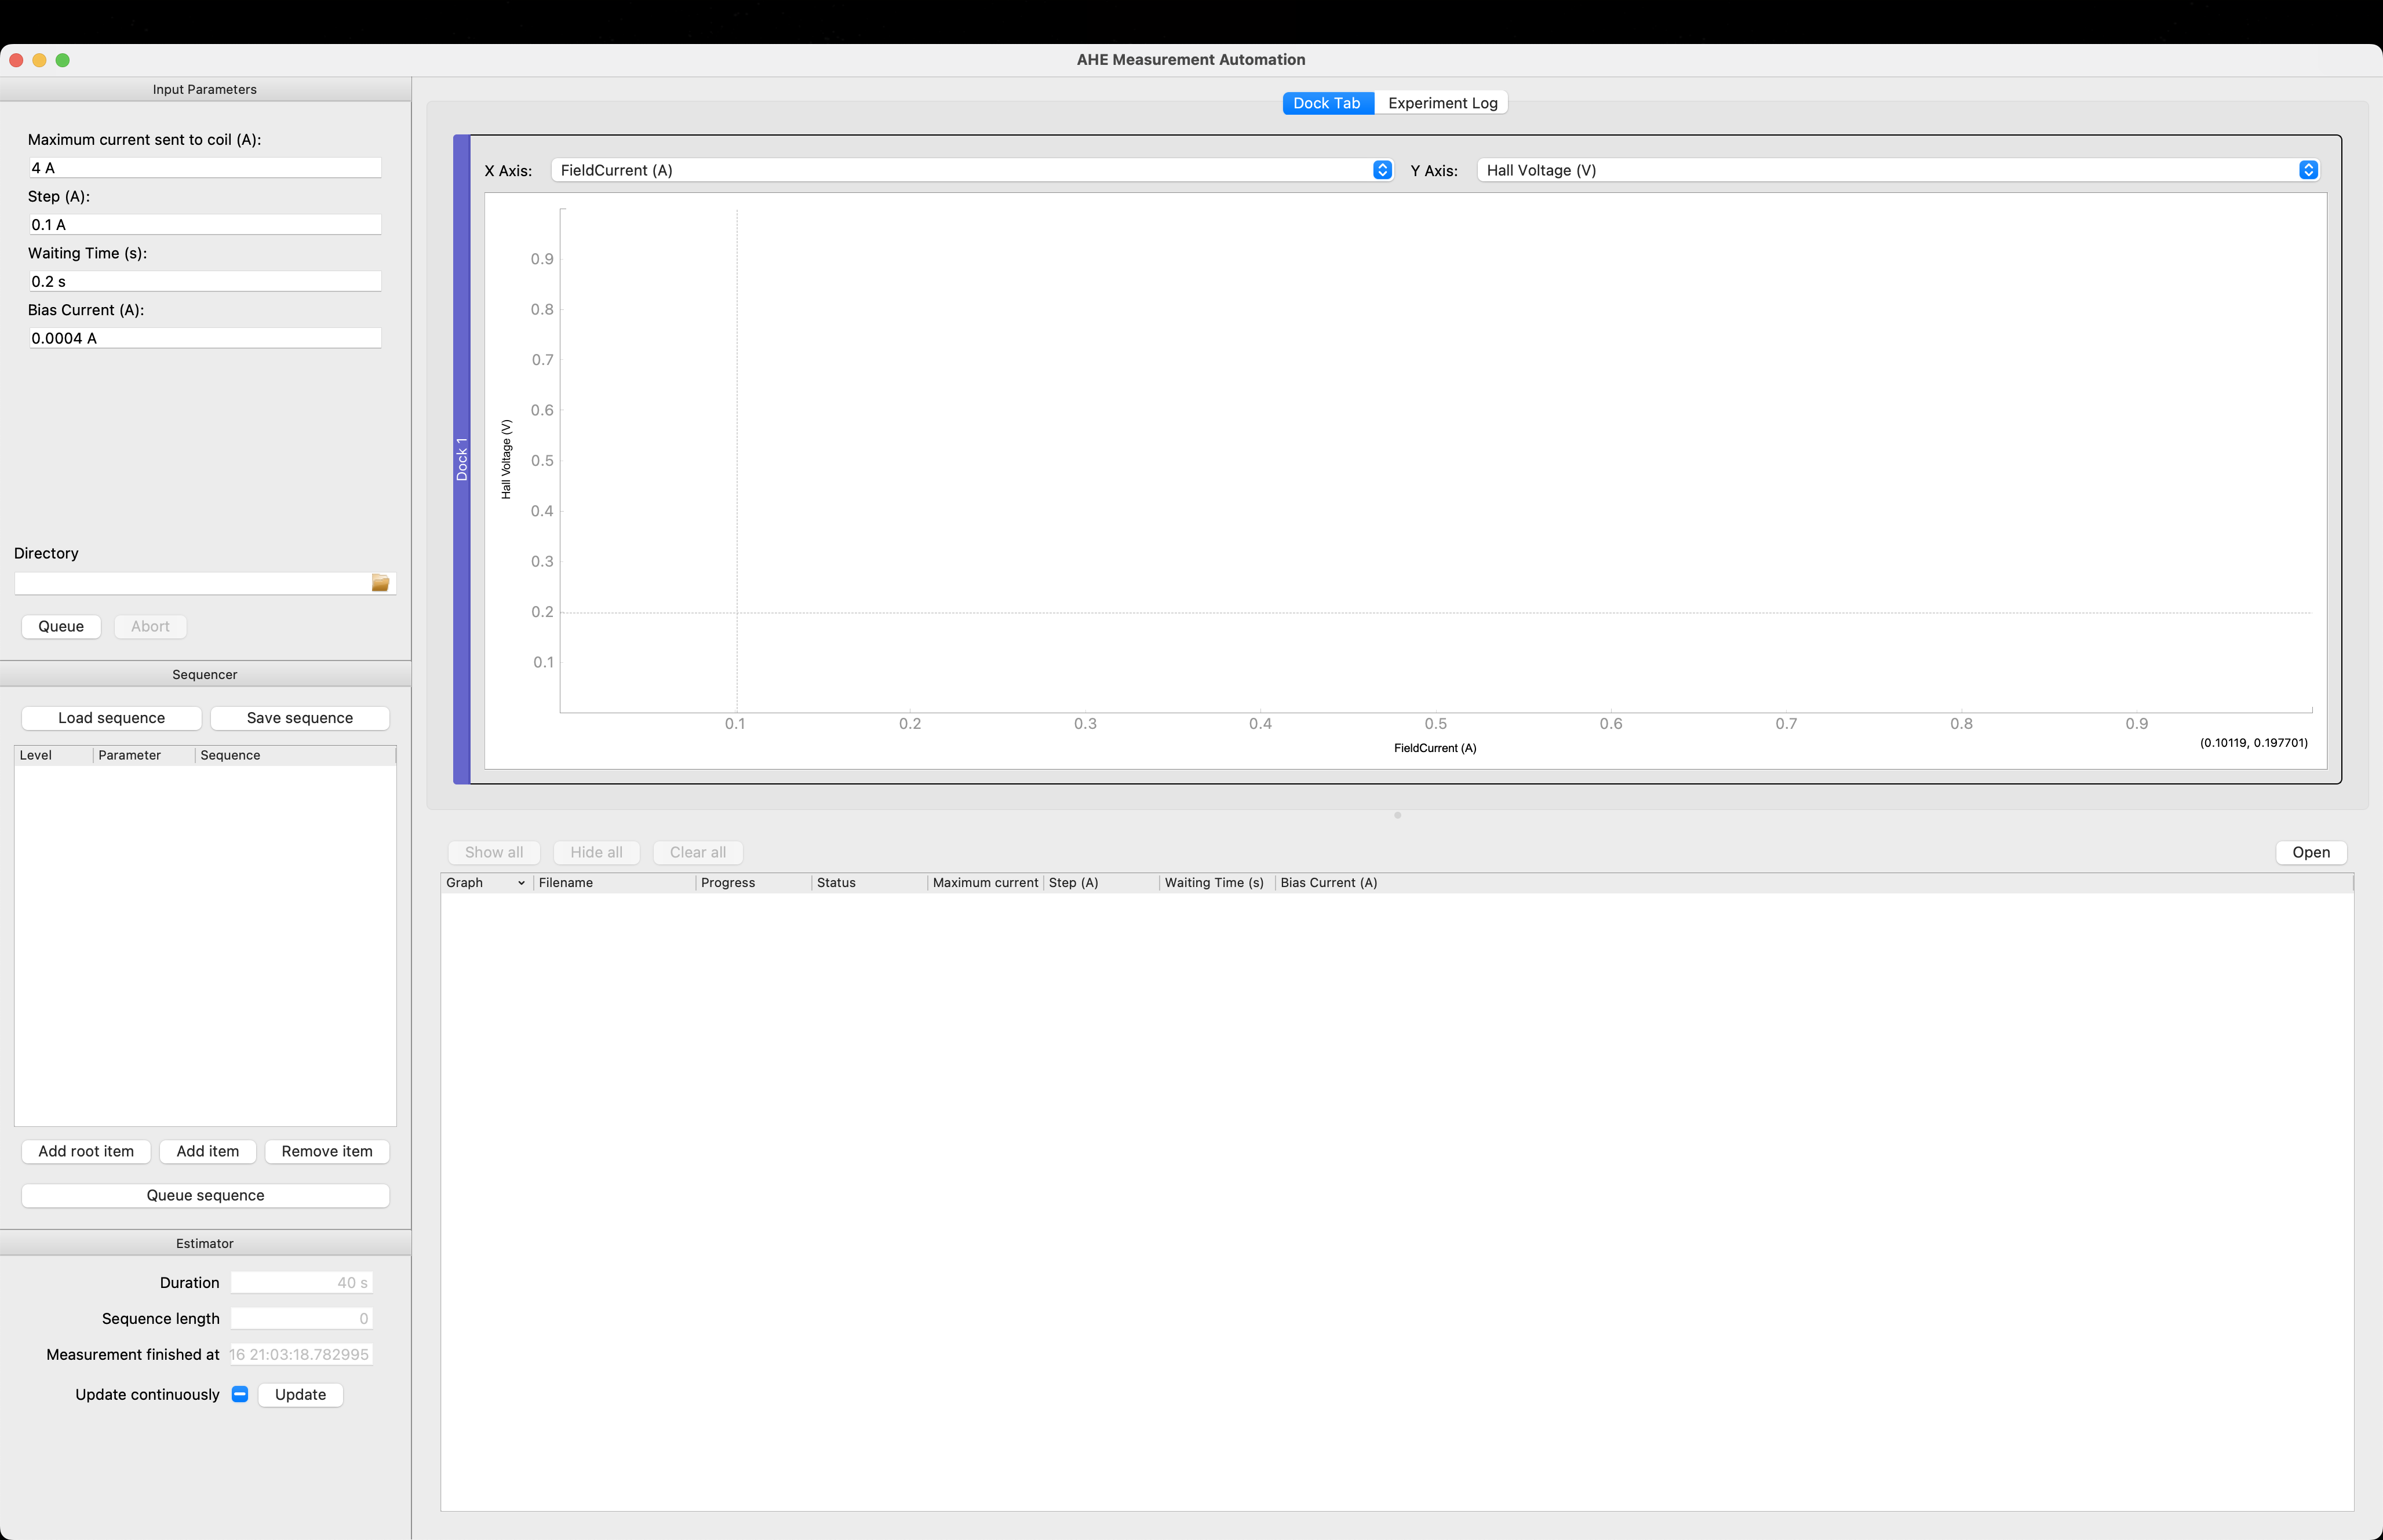
GUI introduction

Block 1:
- Maximum Voltage (mV): This setting determines the strength of positive electric fields. Use a positive value when you want positive electric fields, and set it to 0 if you prefer negative fields.
- Dwelling Time (s): This is the duration for which the targeting electric fields will be applied and held.
- Minimum Voltage (mV): This setting controls the intensity of negative electric fields. Set a negative value when you want negative electric fields and 0 when you want positive fields.
- Voltage Step (mV): This is the increment used when ramping up the voltage to reach the target electric field strength.
- Delay Time (ms): This delay time is used during the voltage step when ramping up to the target electric field strength.
- Compliance Current (uA): This current is applied to protect the sample from high leakage currents.
- Maximum Current Sent to Coil (A): This current is sent to the coil to create looping electromagnetic (EM) fields for generating hysteresis loops.
- Step (A): This is the current increment used during the looping of EM fields.
- Directory: Specify the path where you want to save the data.
Block 2:
The sequencer is provided which allows users to queue a series of measurements with varying one, or more, of the parameters. This sequencer thereby provides a convient way to scan through the parameter space of the measurement procedure.
The sequences can be extended and shortened using the buttons Add root item, Add item, and Remove item. The latter two either add an item as a child of the currently selected item or remove the selected item, respectively. To queue the entered sequence the button Queue sequence can be used. If an error occurs in evaluating the sequence text-boxes, this is mentioned in the logger, and nothing is queued.
1 | -"Maximum Voltage", "[0]" |
Finally, it is possible to create a sequence file such that the user does not need to write the sequence again each time. The sequence file can be created by saving current sequence built within the GUI using the Save sequence button or directly writing a simple text file. Once created, the sequence can be loaded with the Load sequence button.
Block 3:
Graphical Display:
- live plotting for data
- Dock1: IV curve when E-fields are applied
- Dock 2: Coil currents (EM after calibration) looped as a function of the Hall Voltage measured
- Experiments log
Block 4:
A queue system for managing large numbers of experiments
Experiment Running & Data Example
Experiment Running Example
One experiment running example is shown as followings:
- Parameters input:


Applying the E-field:

Looping the electromagnetic fields and receive the Hall voltages:

Applying another E-field and EM looping:

Making the sequencer (Automated Measurement):

Dataset Example
Two files will be generated: 1. the file containing all the data sets and one separate file containing the AHE data


AutoVA - Automated VCMA & AHE Measurement System